Power BI July 2026 Update: Small Release, but a Few Features Are Worth Your Attention
Every month, I take a look at the latest Power BI updates to see what’s new and, more importantly, what could actually improve my daily work.
The July 2026 release isn’t one of those major updates that completely changes the way we build reports. That’s not too surprising considering it’s the middle of the summer. Most of the changes are smaller quality-of-life improvements rather than groundbreaking features.
For me, there is only one standout feature this month: Conditional Formatting for line charts has finally reached General Availability (GA). The remaining updates are nice additions that make Power BI a little more pleasant to work with, but they won’t fundamentally change how most of us build reports.
Below are the features that caught my attention the most.
1. Conditional Formatting for Line Charts is Finally Generally Available
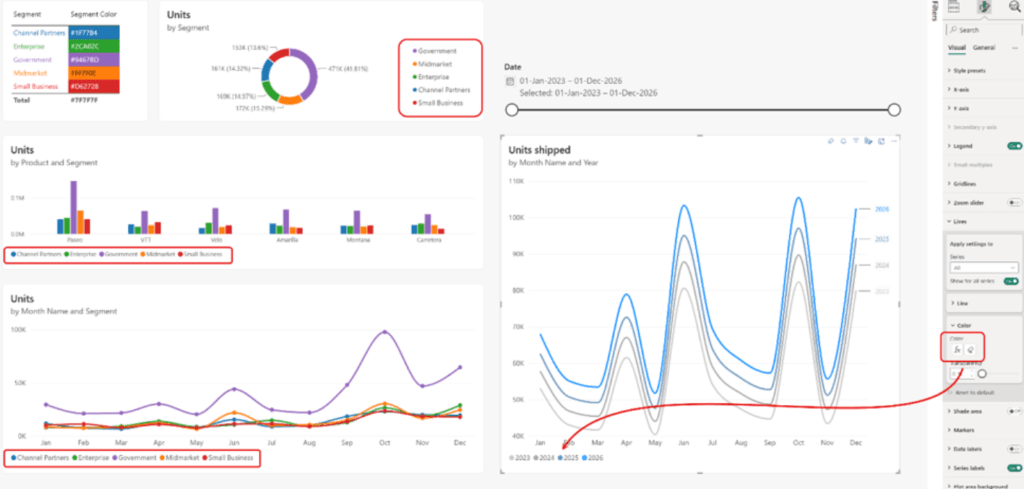
This is easily my favorite feature in the July release. Conditional Formatting for line charts has officially reached General Availability (GA), meaning it has left Preview and is now considered production-ready. It no longer requires enabling preview features and will continue to receive full Microsoft support.
Until now, dynamic formatting worked well for tables and column charts, but line charts were much more limited.
With this update, line colors can now be driven by DAX measures, even when using legends. Data labels and markers automatically inherit the assigned colors, making visualizations much more consistent.
Some practical use cases include:
- highlighting the current year,
- emphasizing KPI thresholds,
- drawing attention to underperforming series,
- keeping category colors consistent across multiple reports.
This may not sound like a revolutionary feature, but I expect to use it regularly in future dashboards.
2. Modern Visual Defaults Keeps Improving
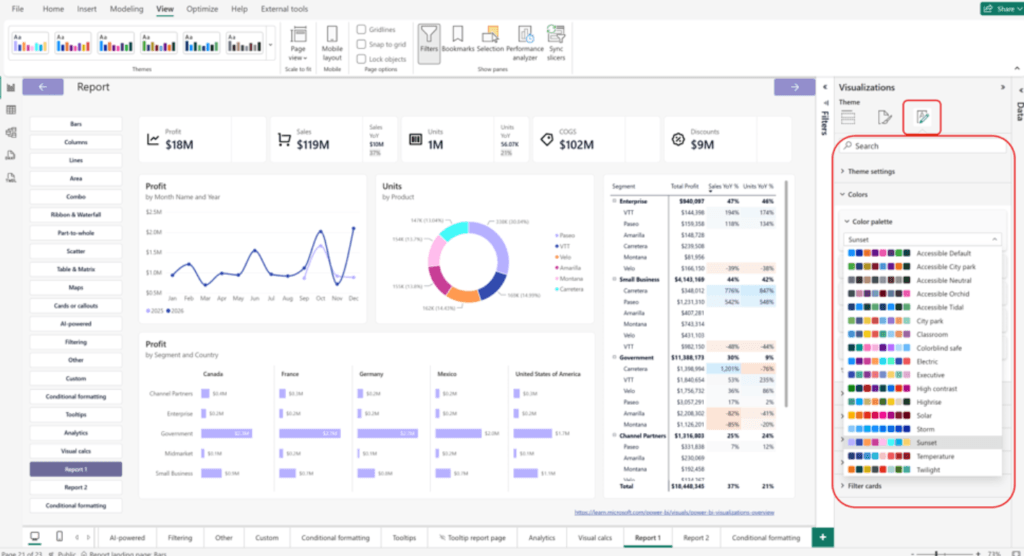
Modern Visual Defaults is still in Preview, but Microsoft continues expanding its capabilities.
It now provides even more control over default colors, borders, shadows, spacing and styling, helping report creators maintain a consistent design across visuals.
Personally, I’m not using it yet.
I’ve spent quite some time building my own custom theme, and until Modern Visual Defaults reaches GA, I’ll stick with my current approach. Still, it’s definitely a feature worth watching.
3. Moving Report Pages is Finally Less Annoying
This is probably the smallest improvement in the July release, but also one of my favorites.
Previously, moving a report page from the end of a large report to the beginning meant dragging the page while repeatedly clicking tiny navigation arrows to scroll through page tabs. Now the page list automatically scrolls while dragging.
A tiny improvement, but one that saves time and removes a surprisingly frustrating part of building larger reports.
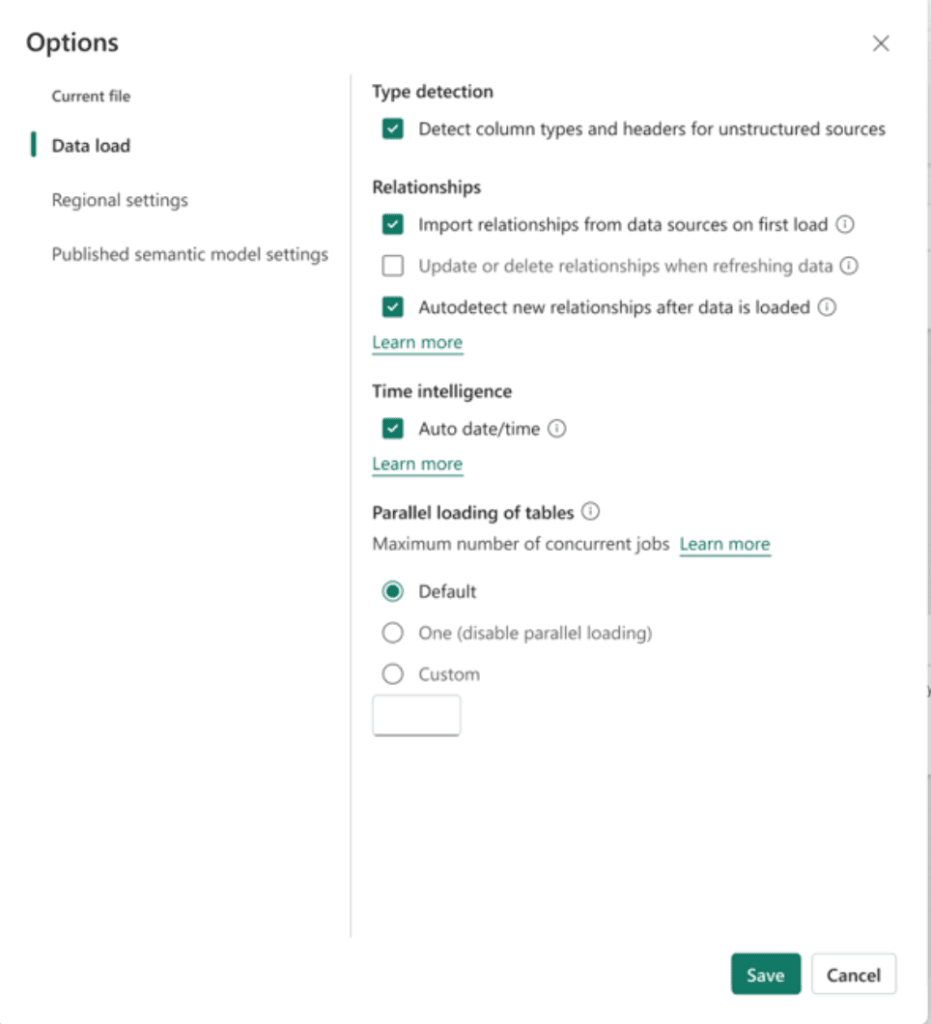
4. More Model Options Available in Power BI Service
Microsoft continues moving more capabilities from Power BI Desktop into the browser.
The July update expands model configuration options directly in Power BI Service, reducing the need to open Desktop just to change individual settings. It’s another step toward a browser-first experience.
5. TMDL View in the Browser
This feature is mainly aimed at advanced users.
Working with semantic models directly as code, without downloading a PBIX file, fits perfectly with Microsoft’s long-term direction for Fabric, Git integration and collaborative development. It’s not something I personally use every day yet, but it’s another indication of where Power BI is heading.
Final Thoughts
If I had to summarize this month’s update in one sentence, it would be:
No major surprises, but several useful improvements.
Conditional Formatting for line charts is clearly the highlight of the release, while the remaining features focus on making Power BI smoother and more enjoyable to use. Sometimes it’s the small improvements, not the headline features, that have the biggest impact on our daily work.
The full list of changes is available on the Microsoft website. Images and visual materials come from official Microsoft sources. https://community.fabric.microsoft.com/t5/Power-BI-Updates-Blog/Power-BI-July-2026-Feature-Summary/ba-p/5303533
March update are here: Power BI Update: March 2026