I recently worked on a genuinely interesting task: forecasting in Power BI.
At first glance, the dataset looked solid. But once you actually try to forecast, one thing becomes very clear. Forecasting is not about how much data you have in total. It is about how many meaningful time points your model can truly learn from.
This is especially important in BI projects, where data often comes aggregated, filtered, or reshaped to fit reporting needs. A dataset may look large, but from a time series perspective it can still be very shallow. And that changes everything when you start thinking about predictions.
This task made me reflect on three common approaches to forecasting in Power BI projects.
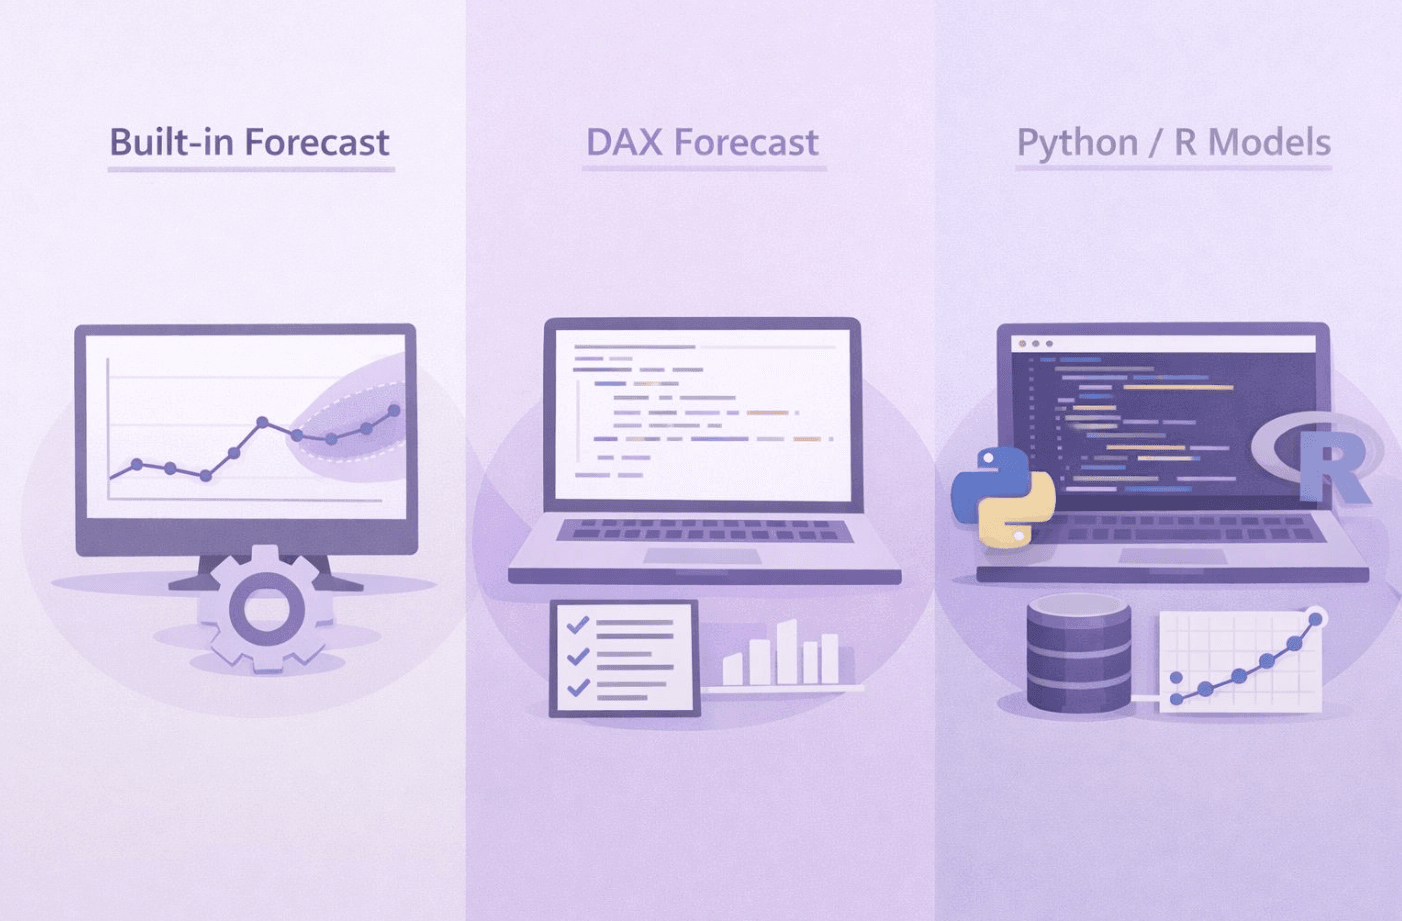
1. Built-in forecasting in Power BI
The built-in forecast is available directly on a line chart. No code, no setup, just a few clicks. Power BI automatically detects trend and seasonality based on historical values and extends the series into the future.
This approach is great for quick insights and exploratory analysis. It allows you to have an immediate conversation with the data and see a possible direction without investing much effort. At the same time, it comes with clear limitations. The model assumes that historical patterns will continue and offers very limited control over how the forecast is generated. You also need enough consistent time points, otherwise the results can be misleading. You can learn more here: Use the Analytics pane in Power BI Desktop – Power BI | Microsoft Learn
2. Forecasting logic implemented in DAX
Writing forecasting logic in DAX gives you more control and forces you to be explicit about assumptions. Instead of relying on an automated algorithm, you define how values should evolve over time. Growth rates, averages, seasonality adjustments or business rules can all become part of the model.
This approach is less convenient and often more work upfront. But it is also more transparent. Anyone reviewing the model can see exactly how the forecast is calculated. In many business scenarios, this clarity is more valuable than mathematical sophistication.
3. External models using Python or R
The most flexible option is to use external forecasting models with Python or R. This opens the door to advanced time series techniques, proper validation, confidence intervals, and more robust handling of complex patterns.
The trade-off is complexity. You need additional skills, more maintenance, and tighter integration between Power BI and external scripts. For many business questions, this level of sophistication is simply not necessary.
The key takeaway from this task was surprisingly simple.
Forecasting is not about choosing the most advanced tool available. It is about choosing the right level of complexity for the data, the business question, and the decision that will be made based on the result.
Sometimes a simple built-in forecast is enough to support a discussion. Sometimes a rule-based approach in DAX gives better control and trust. And sometimes the best decision is not to forecast at all, especially when the data does not support meaningful predictions.
Did you know about the built in forecasting feature in Power BI?